Interventional_DRL
Script in R langage to extract data in DoseWatch Database to established DRL in interventional radiology in regards with French law. The script generate also DRL statistics and boxplot on the major dose parameters.
You can download the project at this link even if it’s recommended to clone or fork the repo :
Prerequisite
Several R packages are mandatory but the script analyze your system and installs, if necessary, missing packages.
In your project root path you need to have one folder named “data” (and put your database export here) and another folder named “output” where the output files will be placed there.
You have to export your database from DoseWatch for a unique interventionnal room and for a unique year. Then you will get to files : the general and the detailled excel file
You have to convert in .csv the detailled .xlsx file
Becareful the DRL files generation is only adapt for the french law format.
Adaptation to your workstation environment
You have to edit the following lines in order to run the script :
-
line 94 : edit the name of the .csv file to adapt with your own configuration,
-
from line 287 : edit the tittle (in French language) of the graphs if necessary.
Test environment
This script have been tested in R 4.2.2 version in Rstudio v2022.12.0+353 in macOS Monterey version. But it should work on any OS system if your R program have the ability to work with additional R packages
Additional R packages list available from CRAN
| Package | Version | Citation |
|---|---|---|
| base | 4.2.2 | R Core Team (2022) |
| doMC | 1.3.8 | Analytics and Weston (2022) |
| grateful | 0.1.11 | Rodríguez-Sánchez, Jackson, and Hutchins (2022) |
| openxlsx | 4.2.5.1 | Schauberger and Walker (2022) |
| rprojroot | 2.0.3 | Müller (2022) |
| tictoc | 2.0.3 | Izrailev (2022) |
| tidyverse | 1.3.2 | Wickham et al. (2019) |
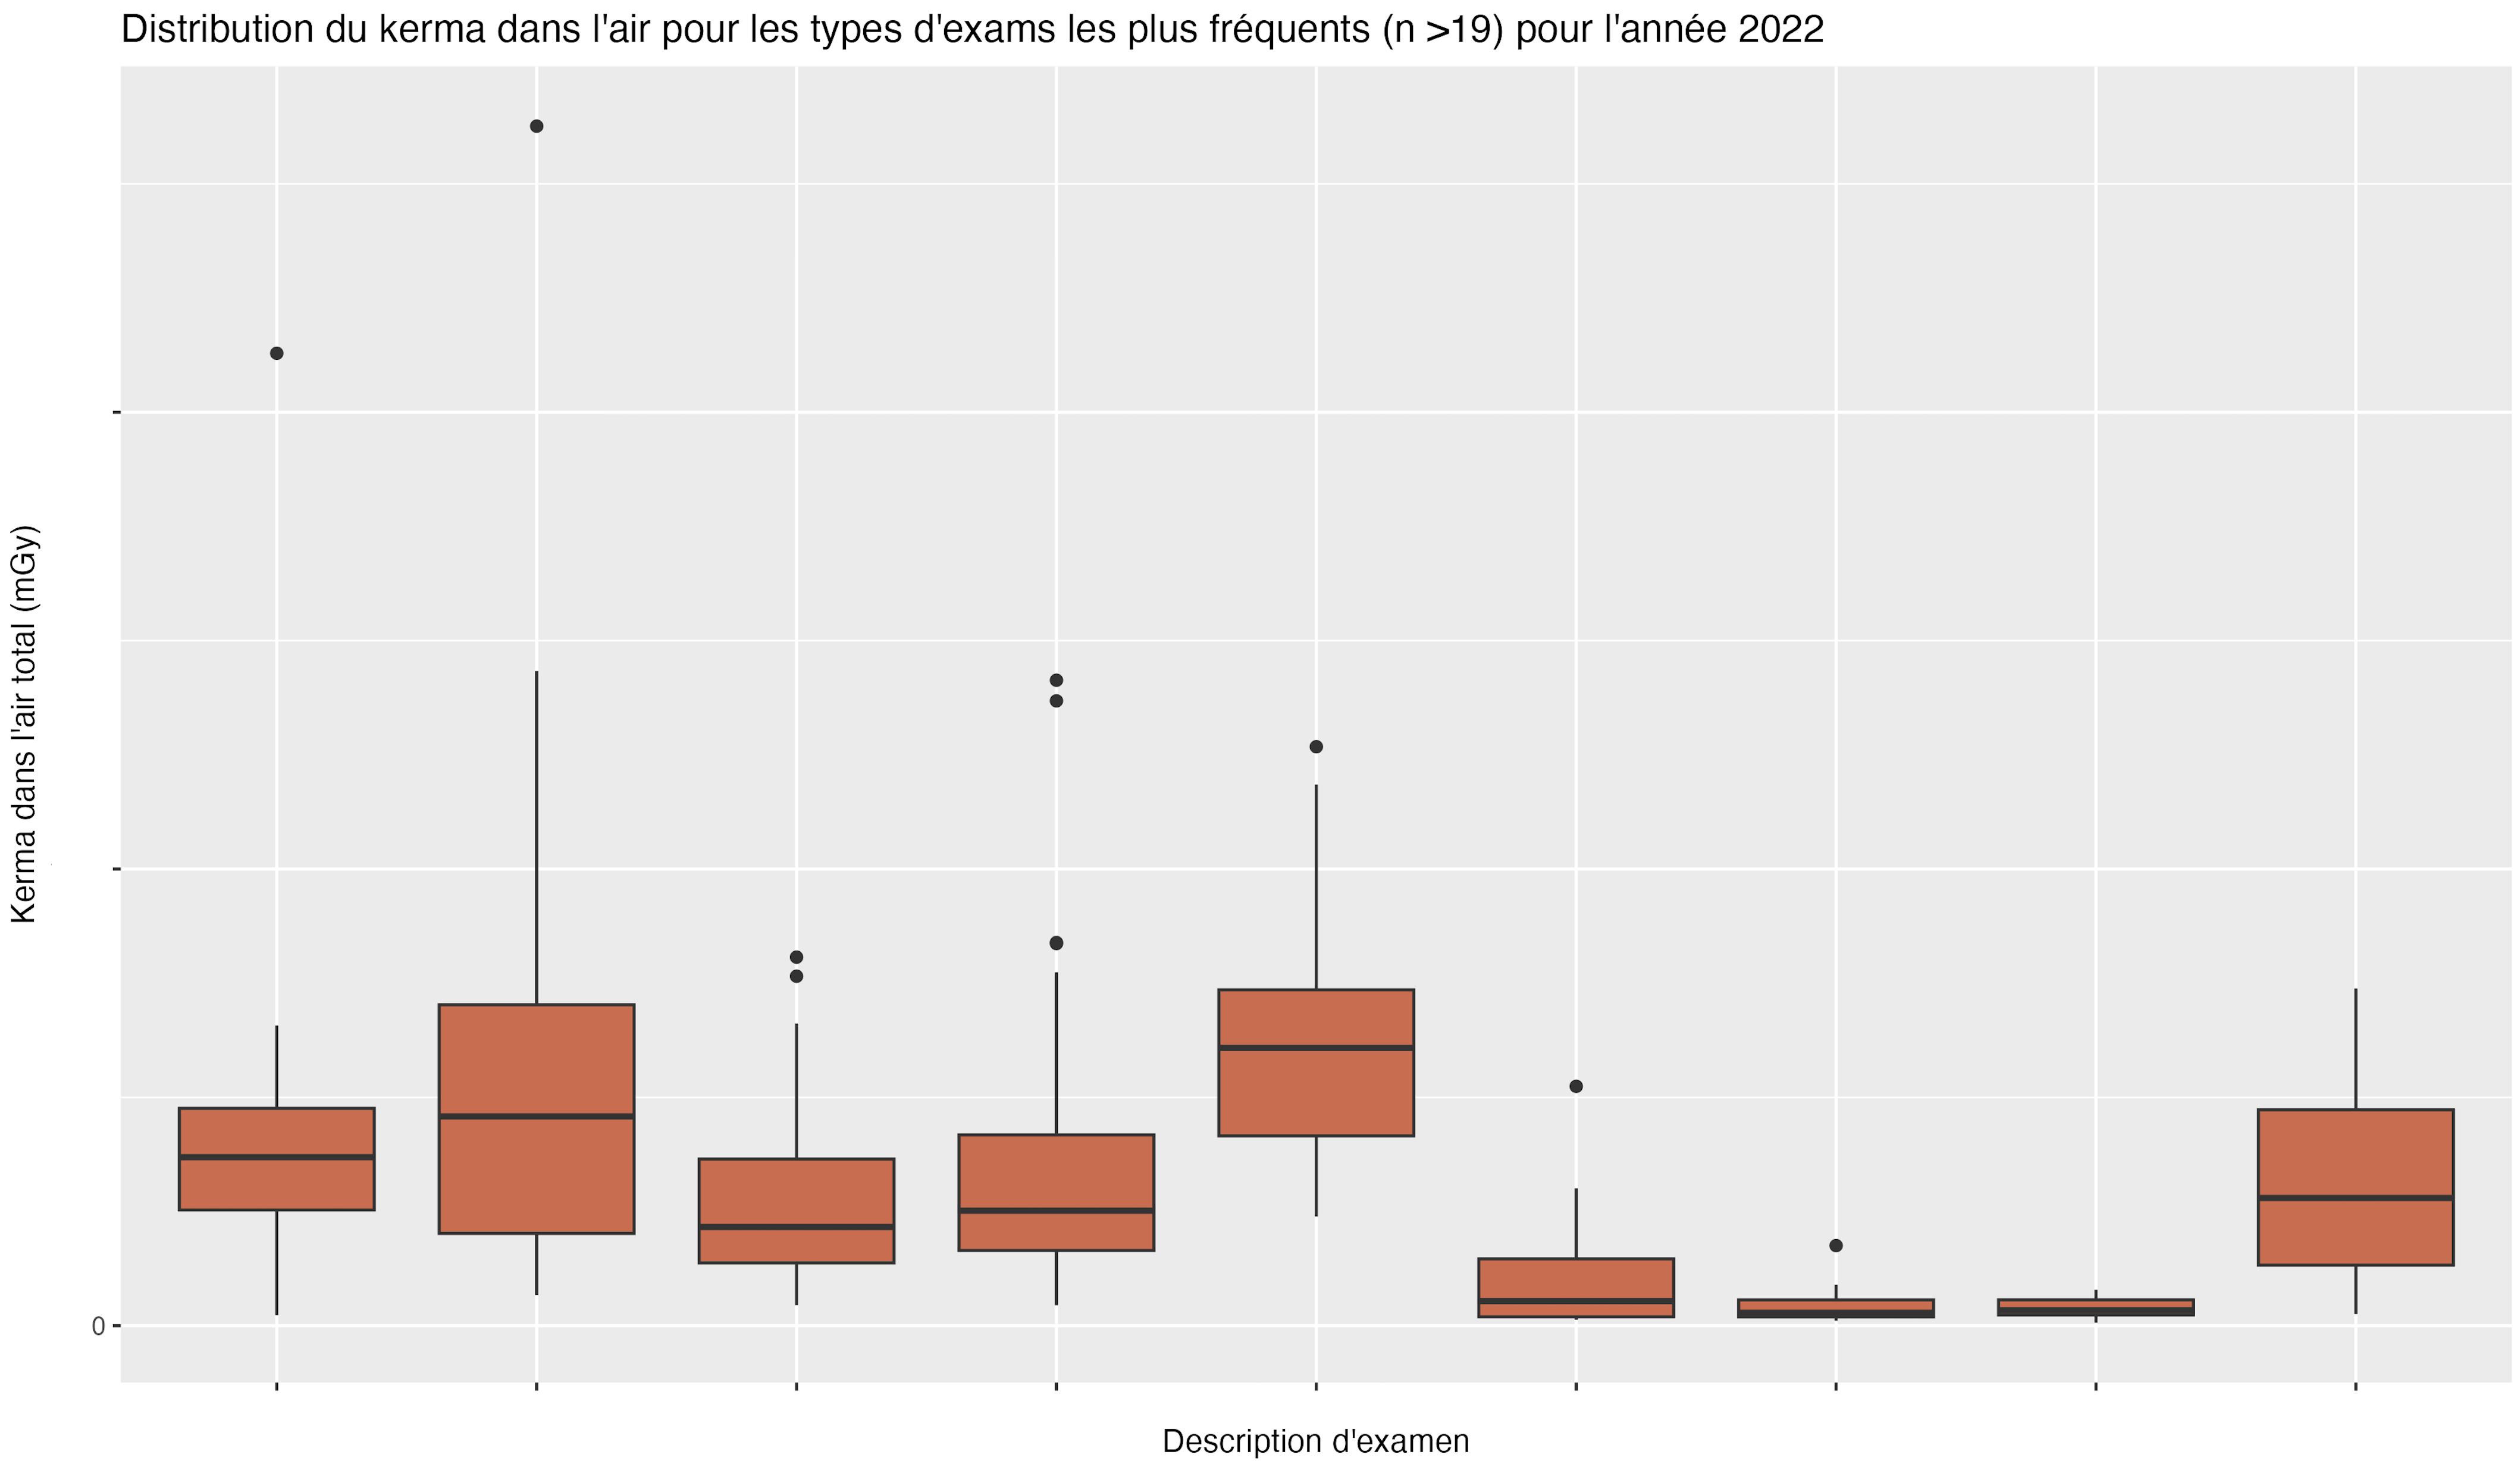
Example of graphics output
In addition with DRL .csv file generation, the script help you to understand the patient exposure with several graphics output such as PSD, DAP, air kerma metrics. You can see for instance this one (values are masked for confidentiality reasons) :